Harleencoder
EXCEL COURSE
MY CERTIFICATE
MY EXPERIENCE IN COURSE
- This course is a beginner and intermediate level course given by Great Learning Platform . This course helped me to understand the basics of excel , different functions , different graphs and charts . This has 5 hour long recorded video lecture which helped me to understad the concepts at my own pace. I learned the basics of Excel along with advanced concepts. This was very easy to understnand applying formula and shortcuts etc. Overall, this course was very interesting and very helpfull .
LIST OF CONCEPT LEARNED
-
SUM : Adds all the numbers in a range of cells.
-
AVERAGE : Calculates the average of numbers in a range of cells.
-
MAX : Returns the largest value from a range of cells.
-
MIN : Returns the smallest value from a range of cells.
-
COUNT: Counts the number of cells that contain numbers.
-
IF : Checks whether a condition is met and returns one value if true and another value if false.
-
VLOOKUP : Searches for a value in the first column of a table and returns value in the same row from another column.
-
INDEX : Returns the value of a cell in a specified row and column of a range.
-
MATCH : Searches for a specified value in a range and returns the relative position of that item.
-
CONCATENATE : Joins several text strings into one text string.
-
LEFT : Returns the leftmost characters from a text string.
-
RIGHT : Returns the rightmost characters from a text string.
-
LEN : Returns the number of characters in a text string.
-
UPPER : Converts text to uppercase.
-
LOWER : Converts text to lowercase.
-
AND : Returns true if all arguments are true.
-
OR : Returns true if any argument is true.
-
TODAY : Returns the current date.
-
NOW : Returns the current date and time.
-
DATE : Returns the serial number of a particular date.
-
YEAR : Returns the year from a date.
-
MONTH : Returns the month from a date.
-
DAY : Returns the day of the month from a date.
DIFFERENT TYPES GRAPHS IN EXCEL
-
LINE GRAPH - Line charts can display continuous data over time, set against a common scale, and are therefore ideal for showing trends in data at equal intervals or over time .

-
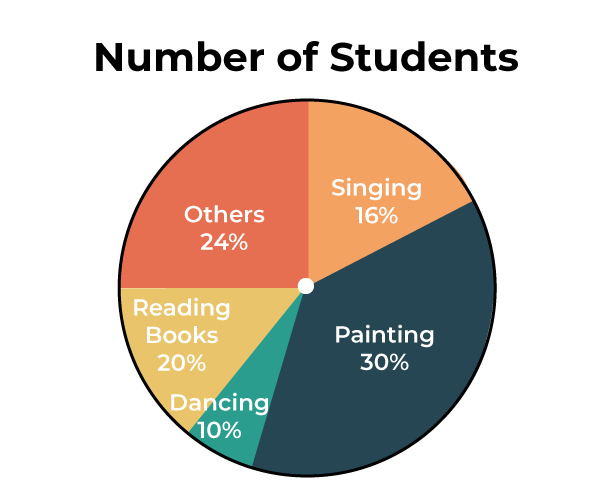
PIE CHART - Pie charts can be used to show percentages of a whole, and represents percentages at a set point in time. Unlike bar graphs and line graphs, pie charts do not show changes over time. The following pages describe the different parts of a pie chart.

-
BAR GRAPH - A bar chart or bar graph is a chart or graph that presents categorical data with rectangular bars with heights or lengths proportional to the values that they represent.
.webp)
-
SCATTER GRAPH - Scatter plots are the graphs that present the relationship between two variables in a data-set. It represents data points on a two-dimensional plane or on a Cartesian system.
SUMMARY
- This is a very good course which will surely help me in my professional life. It was very interesting to watch video lectures and learn different function and graphs at my own pace. In short I found this beginner level excel course very helpfull and intersting.